ER Diagram Generator: Describe It, Get an Editable ERD

Write a few sentences about your system. The AI ER diagram generator drafts tables, primary and foreign keys, and crow's foot relationships as a Draw.io file you can edit.

0/2000

Try an example

Free preview, no account needed. Pay $1.99 only to unlock the editable file.

From a Plain Description to a Real Database Diagram

Drawing an entity relationship diagram by hand means placing every table, typing every column and fixing every connector. This ER diagram generator does the first draft for you, in the notation your course or team already uses, and hands it over as an editable Draw.io file.

Tables With Keys and Types

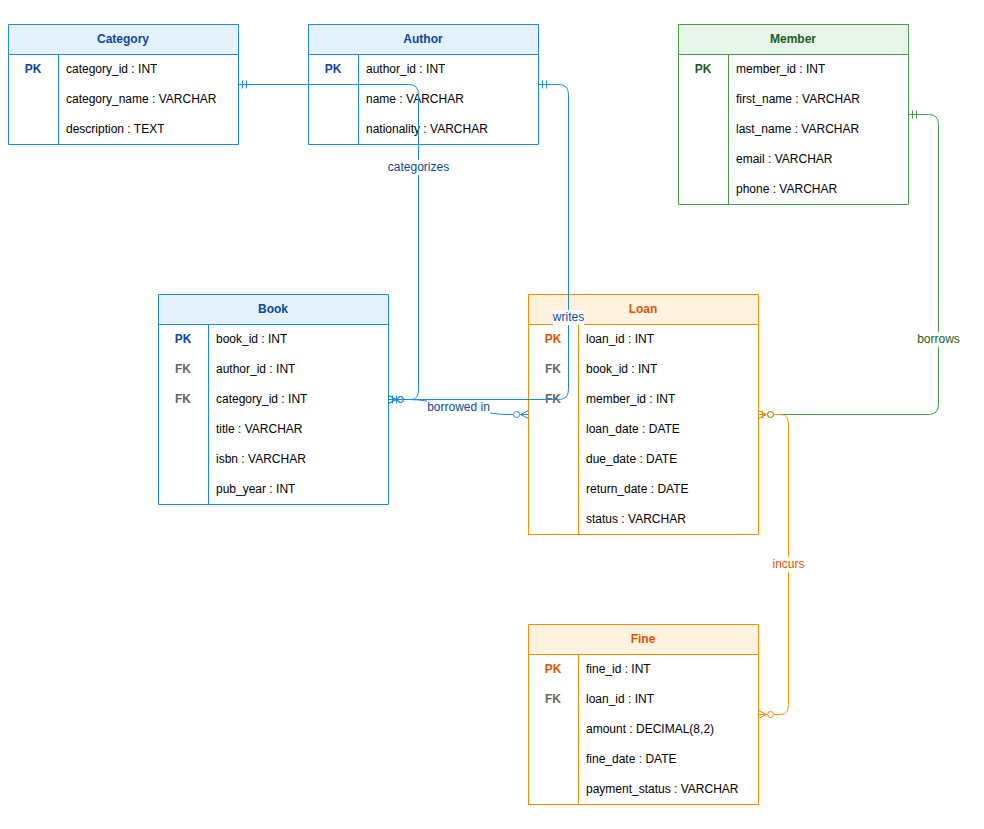
Every entity gets a primary key, the foreign keys its relationships need, and realistic columns with SQL-like types such as INT, VARCHAR and DATE.

Crow's Foot Relationships

One-to-one, one-to-many and many-to-many links are drawn with crow's foot ends, and many-to-many pairs get a junction table.

Editable, Not a Picture

The result opens in Draw.io as real shapes. Rename a column, add a table or move a relationship without starting over.

Diagrams Generated From One Paragraph

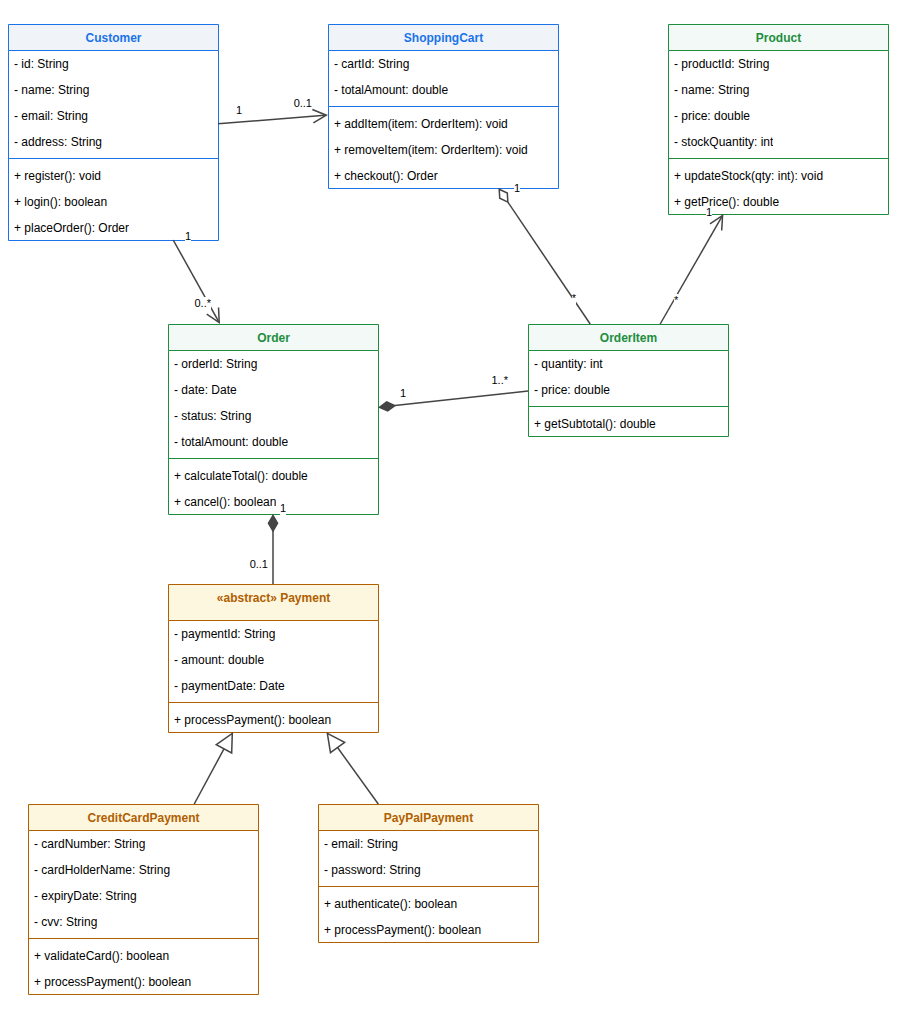
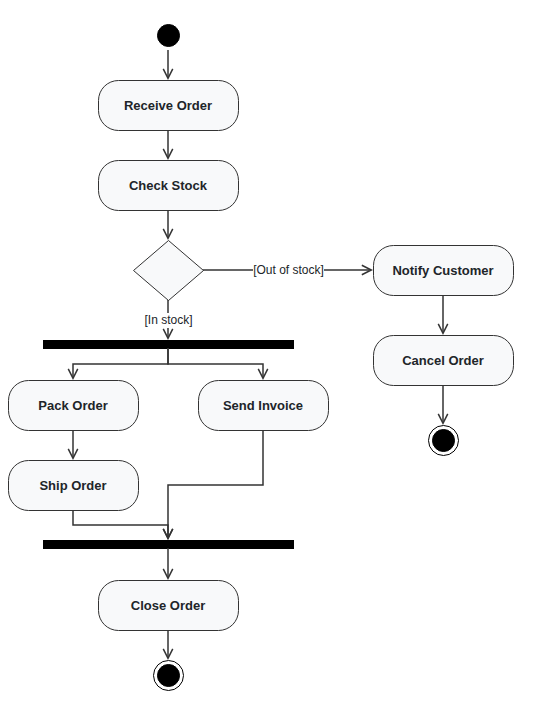
Each example below came from a short description typed into the ER diagram generator, with no manual layout.

Three Steps

How to Generate an ER Diagram From Text

The ER diagram generator turns a paragraph into a diagram in about a minute.

1

Describe the System

Type what the system stores and how things relate, or start from one of the examples above the button.

2

Review the Free Preview

The AI draws the tables and relationships and shows a watermarked preview so you can check the model.

3

Unlock and Edit

Unlock the editable Draw.io file, adjust it in the online editor or with AI edits, and download it.

Guide

Getting Good Results From an AI ER Diagram

A few habits make the generated model closer to what you need on the first try.

What an ER diagram shows

An entity relationship diagram describes the data a system stores. Entities become tables, attributes become columns, and relationships show how rows in one table refer to rows in another. The crow's foot symbols at each end tell you whether a side is one or many, and whether it is optional.

Because it sits between the idea and the actual database, the diagram is where most design mistakes are cheapest to fix. That is why courses ask for it and why teams review it before writing migrations. An ER diagram generator speeds up the drawing so you can spend the time on the design itself.

How to describe your system

Name the main things the system keeps track of and how they relate. Sentences such as "customers place orders" or "each order contains many products" are enough for the model to find entities and cardinality. Mention anything unusual, like an item that can belong to several categories.

If you already know some columns, list them; otherwise the ER diagram generator fills in typical ones. Keep each description to one system. For a large project, generate the core tables first and add the rest later with AI edits, which keeps the layout readable.

Checking and refining the result

Read the preview the way a reviewer would. Does every table have a primary key? Does every foreign key point to the right table? Are many-to-many relationships resolved with a junction table? Most problems show up in a quick pass over these three questions.

After unlocking, fix details directly in the Draw.io editor or describe the change in the AI panel. Because the output is a normal Draw.io file, you can also export it to PNG, PDF or SVG for a report, or keep it in your repository next to the schema.

When to use a UML diagram instead

An ER diagram models stored data. If you need to show behavior, such as the steps of a process, the messages between services, or the classes in your code, a UML diagram fits better. The UML diagram generator on this site covers class, use case, sequence, activity and state diagrams.

Many assignments ask for both: an ERD for the database and a class or use case diagram for the application. Generating both from the same description gives you a consistent starting point, and each opens in the same Draw.io editor.

Why Use This ER Diagram Generator

Built for students, analysts and developers who need a clean data model quickly and want to keep editing it.

Plain Language Input

Describe the system the way you would explain it to a classmate. The model works out the entities, attributes and relationships.

Sensible Defaults

When your description is short, the ER diagram generator adds the obvious columns, such as names, dates and statuses, and marks keys clearly.

Standard Notation

Tables follow the familiar layout with a PK and FK column, and relationships use crow's foot cardinality that teachers and reviewers expect.

Free Preview First

See a watermarked image of the result before you pay anything. Only unlock the editable file when the diagram is right.

AI Edits After Unlock

Ask for changes in plain language, such as adding a table or renaming a column, and the diagram updates in the online editor.

Any Language

Write your description in English, Chinese, Indonesian, Spanish or another language, and the labels follow your language.

FAQ

ER Diagram Generator FAQ

Answers about notation, pricing, editing and limits.

1

Is the ER diagram generator free?

Generating a watermarked preview is free, up to 3 previews a day. Unlocking the editable Draw.io file costs one credit, or a small one-time payment without an account.

2

Which notation does it use?

Tables list each column with PK and FK markers, and the ER diagram generator draws relationships in crow's foot notation for cardinality and optionality.

3

Can I edit the diagram after it is generated?

Yes. The unlocked file opens in the Draw.io editor, and you can also ask the AI for changes such as adding a table or renaming columns.

4

Does it work as an ERD generator for SQL?

The diagram uses SQL-like types and keys, so it is a good basis for writing CREATE TABLE statements. It does not connect to or change a real database.

5

How large can the diagram be?

Descriptions up to 2,000 characters work well, which is usually enough for 5 to 15 tables. Generate the core first and add more with AI edits.

6

Can I write my description in another language?

Yes. Write in your own language, and the table and column names follow the language you used.

7

Is this an AI ER diagram generator I can use for homework?

Many students use it to get a clean first draft. Check the result against your course's rules, since teachers may expect a specific notation or naming style.

8

What formats can I export?

You get a .drawio file, which Draw.io can export to PNG, JPG, SVG and PDF. The site's converters can also turn it into PowerPoint.

Generate Your ER Diagram Now

Describe your database in a few sentences and let the ER diagram generator draw the first version for you.