Org Chart Maker: Describe Your Team, Get an Org Chart

Write who reports to whom, or upload a picture of an existing chart. The AI lays out names, titles and reporting lines as an org chart in Draw.io, Mermaid, PNG, JPG, SVG, PDF or PowerPoint.

Diagram type

Output format

The output format can't be changed after the diagram is generated.

0/2000

Try an example

Free preview, no account needed. Pay $1.99 only to unlock the editable file.

A Clear Org Chart Without Dragging Boxes Around

Drawing an organizational chart by hand means lining up dozens of boxes and redoing the layout every time someone joins or a team moves. This org chart maker reads a plain description of your team and builds the hierarchy for you.

Names, Titles, Levels

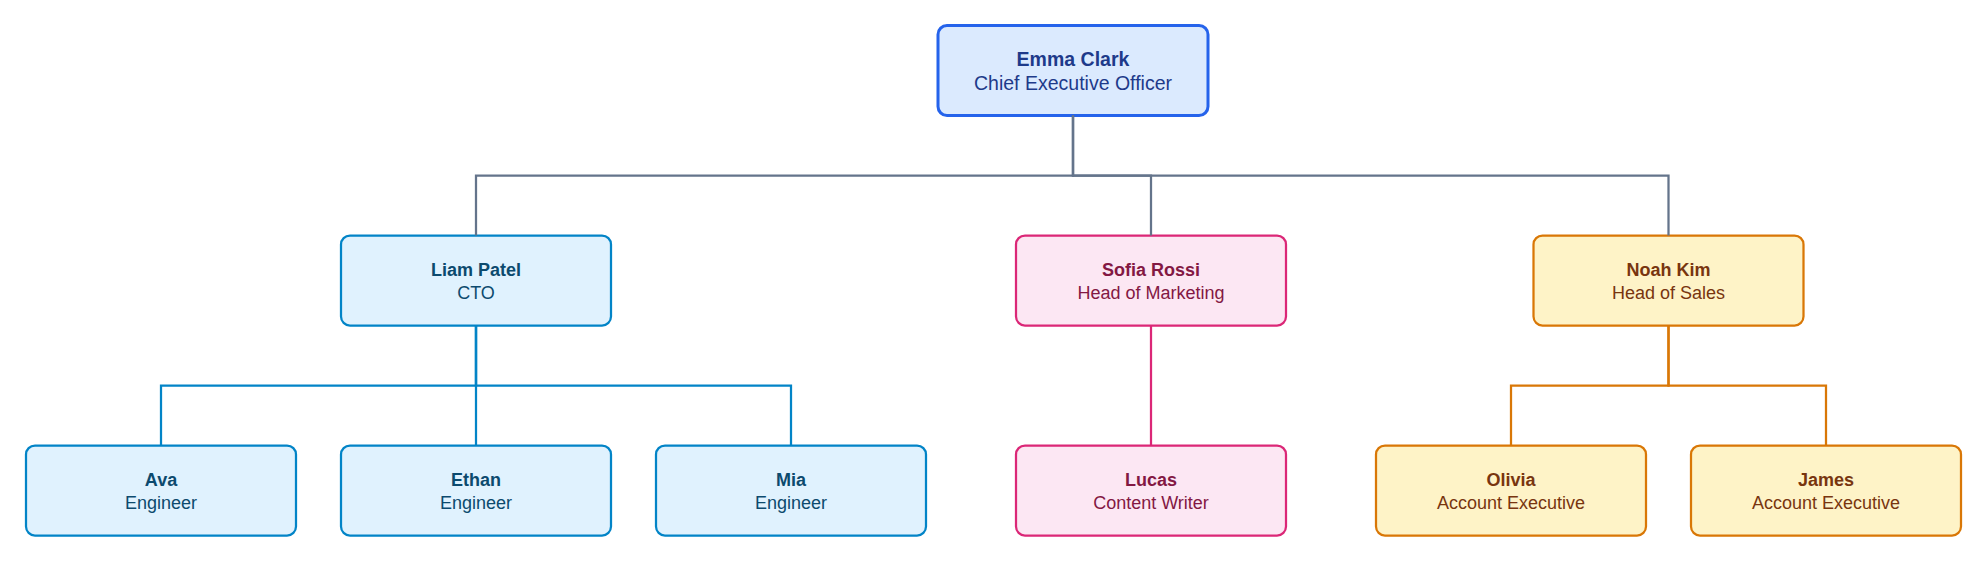
Every person gets a card with their name and job title, and each reporting level sits on its own row, top down.

Real Reporting Lines

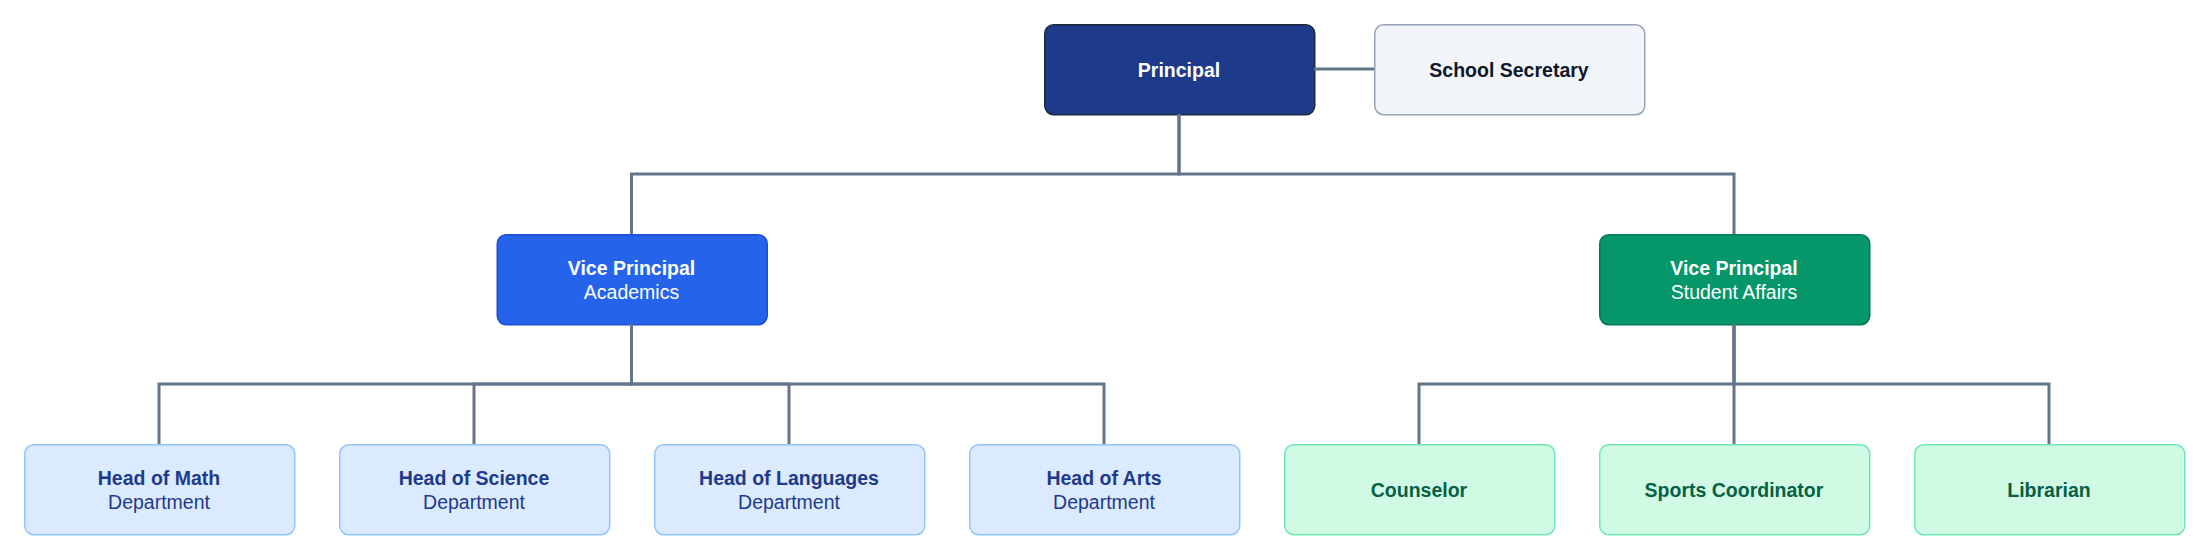
The org chart maker draws solid lines for direct reports, dashed lines for dotted-line reporting, and assistants placed beside their manager.

Any Format You Need

Get an editable Draw.io or Mermaid chart, or a finished PNG, JPG, SVG, PDF or PowerPoint file, from the same description.

Org Charts Built From One Description Each

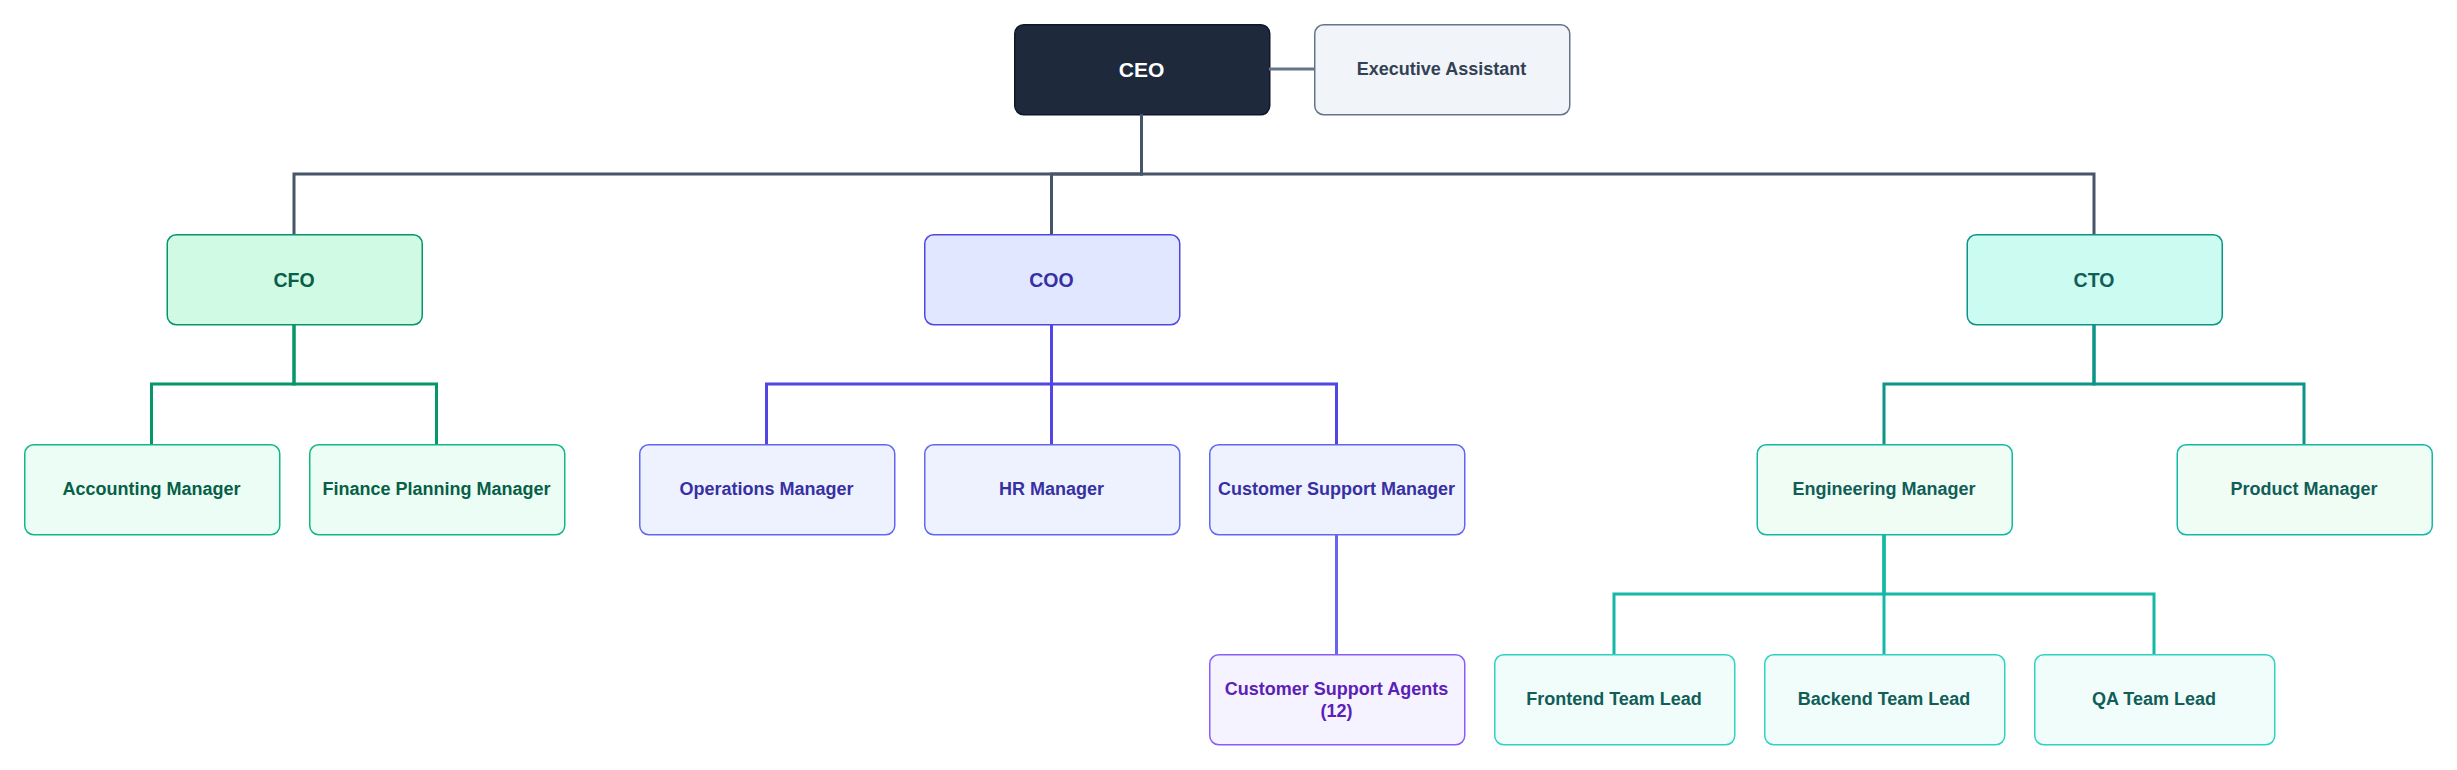
The org chart maker drew each example below from one of the short descriptions in the examples above, with no manual layout.

Three Steps

How to Make an Org Chart From Text

The org chart maker turns a short description of your team into a finished chart in about a minute.

1

Describe Your Team

Pick the output format, then write who leads the organization and who reports to whom, or start from one of the examples above the button.

2

Review the Free Preview

The org chart maker places every card, level and reporting line and shows a watermarked preview so you can check the structure.

3

Unlock and Edit

Unlock the editable file, refine it in the online editor or with AI edits, and download it.

Guide

Making Org Charts With AI

What an organizational chart shows, how to describe your team so the AI gets it right, and where this tool fits.

What an org chart shows

An organizational chart shows how a company, school or team is structured. Each box is a person or a position, and each line connects a manager to the people who report to them. Reading from the top down, you can see who leads each area, how many levels there are and where a new person fits.

Org charts are used to onboard new employees, plan hiring, explain a reorganization, and show investors or clients who is responsible for what. An org chart maker saves the hours it takes to align and resize every box by hand.

How to describe your team for the AI

Start with the person at the top, then list who reports to them, and continue level by level. Write names and job titles together, for example "Liam Patel, CTO". If you only know the roles, write the roles; the chart will show them without inventing names.

Mention assistants, dotted-line reporting and vacant positions explicitly. For large teams, give the size instead of every name, such as "a support team of 12 agents", and the org chart maker shows it as one box so the chart stays compact.

AI compared with org chart templates

Most tools start you with a template and a blank tree, and you add boxes one by one. That works for a few people, but a company with four levels and thirty roles takes a long time to lay out, and every change means rearranging branches.

With an AI org chart maker you describe the structure and the layout is done for you. Because the result is a standard Draw.io file, you can still fine-tune every box by hand, add photos, or change colours to match your brand.

Keeping the chart up to date

When people join, leave or move, open the chart in the editor and describe the change in the AI panel, or edit the boxes directly. Export it to PNG or PDF for a handbook or a slide, or keep the .drawio file in your shared drive so the next update starts from the current version.

If you already have an org chart as a picture or in an old slide deck, upload it on the image tab and the org chart maker rebuilds it as an editable chart.

Why Use This Org Chart Maker

Built for HR teams, founders, managers and students who need an organizational chart that is easy to read and easy to update.

Plain Language Input

Describe your team the way you would explain it to a new hire. The model works out the levels and who reports to whom.

Large Teams Stay Readable

When a manager has many direct reports, the org chart maker stacks them in a column instead of one very wide row.

Departments in Colour

The org chart maker gives each department or function its own light colour, so the structure of the company is visible at a glance.

Free Preview First

Check a watermarked image of the result before you pay. Unlock the editable file only when the structure is right.

AI Edits After Unlock

Ask for changes such as "move the Product team under the CTO", and the chart updates in the editor.

Convert an Existing Chart

Switch to the image tab and upload a screenshot or photo of an old org chart to get an editable copy you can update.

FAQ

Frequently Asked Questions

Answers about making organizational charts from text.

1

Is the org chart maker free?

A watermarked preview is free, up to 3 a day. The editable file costs one credit, or a small one-time payment without an account.

2

Which output formats can I choose?

Draw.io, Mermaid, PNG, JPG, SVG, PDF or PowerPoint. Pick the format before generating. Draw.io and Mermaid stay editable with AI edits; the others are finished files to download.

3

Do I need to list every employee?

No. Name the people you want to show, and give team sizes for the rest, such as "8 engineers". Larger teams appear as one box with the count, so the chart stays readable.

4

Can it show assistants, dotted lines and vacant roles?

Yes. The org chart maker places assistants beside their manager, dotted-line reporting uses a dashed line, and vacant positions get a dashed box marked as open.

5

Can I add photos or change colours?

Yes. After unlocking, open the chart in the Draw.io editor to add photos, change colours or fonts, or ask the AI panel to restyle it.

6

How big can the organization be?

Descriptions can be up to 2,000 characters, which covers most companies with a few levels. For a very large organization, make one chart per division.

7

Can I write the description in another language?

Yes. Write in English, Chinese, Indonesian, Spanish or most other languages, and the names and titles in the chart use the language you wrote in.

8

Can I turn an existing org chart image into an editable one?

Yes. Switch the generator to the image tab and upload a screenshot, scan or photo of the chart, and it is redrawn as an editable diagram.

Make Your Org Chart Now

Describe your team and let the org chart maker draw the first version for you.