
What a Venn diagram shows
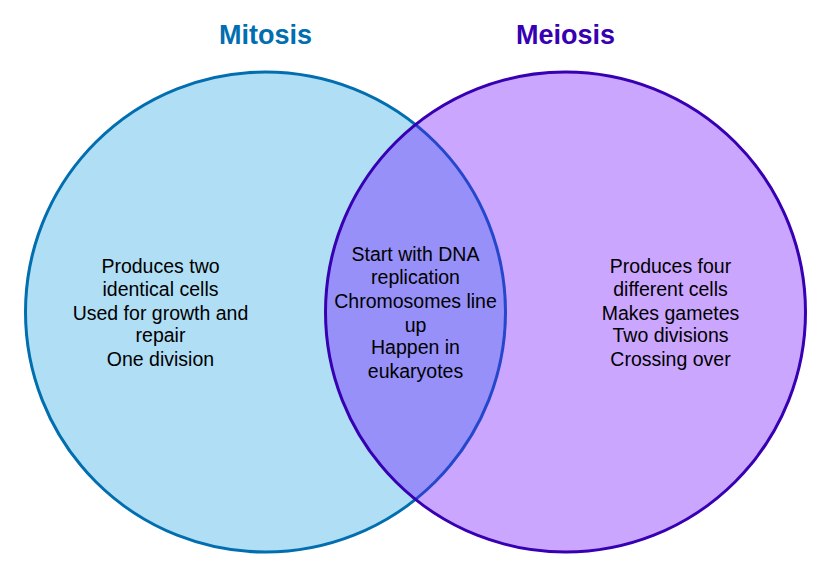
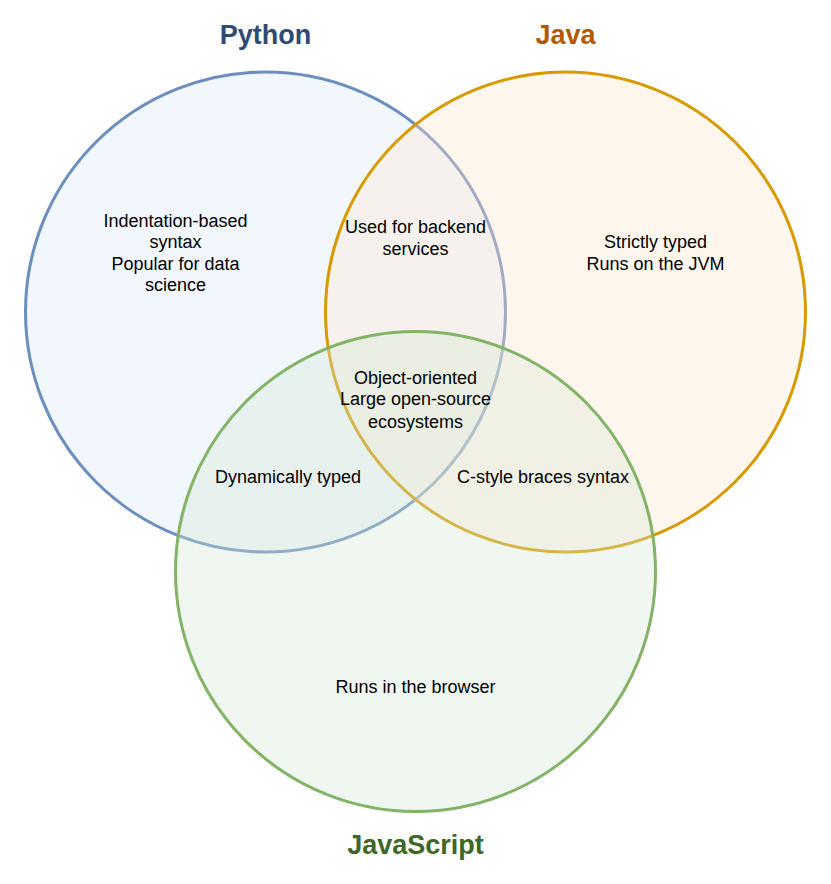
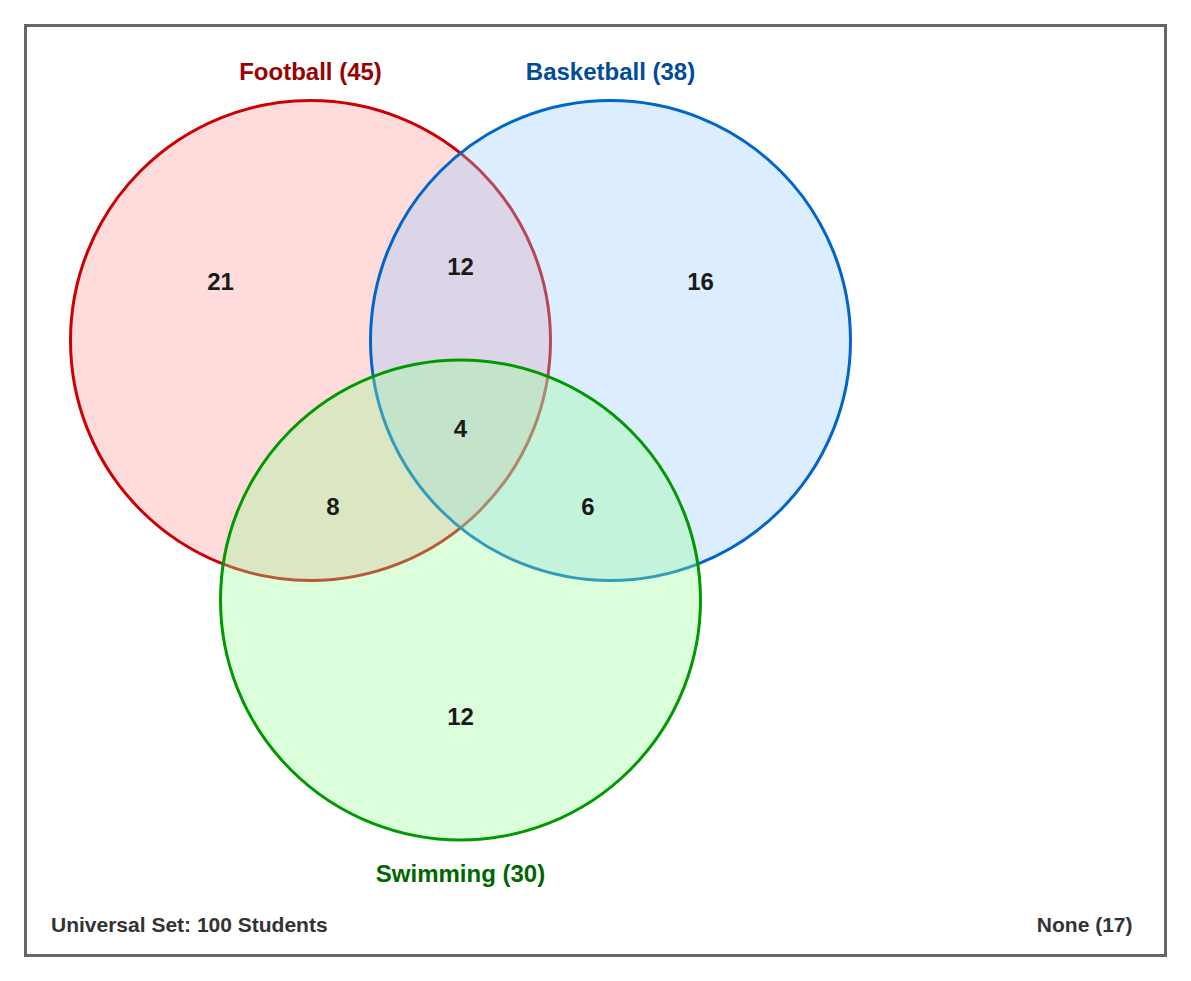
A Venn diagram uses overlapping circles to show the relationship between groups. Each circle is a set, the overlaps hold what the sets share, and the parts that do not overlap hold what is unique to one set. A rectangle around the circles can stand for everything being considered, including items in no set.
Teachers use them for compare-and-contrast tasks, set theory and probability. Teams use them to compare products, skills or customer groups. A Venn diagram generator lets you focus on deciding what goes where instead of resizing circles.